Hi gang. I thought I would start a thread where we can share anything from the full on tutorial to the little discoveries. There is much to learn with the DNA200 chip as well as the software that powers it. I’ll start off with a simple discovery.
The software has a feature called Device Monitor which will chart and record several of the variables that go into a puff in temperature control, as well as monitoring several system functions and readings. You can record a session or simply watch in real time. I was playing around with it this evening and it really made sense how not only can you get a visual of how the temperature control is working (really advanced technology with this chip) but also how it could be used to help determine issues where you may not be getting the kind of vape you’re looking for.
As many know, temperature control is based on the fact that certain materials - most prominent with TC are nickel, titanium and stainless steel) will change resistance with changes in temperature. This is based on a formula for each wire where each wire type will change resistance an exact amount relative to the change in temperature. This is the coefficient you’ve heard of, and it’s predictable for the mod which is programmed to know what those resistance changes mean in terms of temperature.
Well it’s also known that part of this working in a desirable way for vaping is that both air and liquid are supplied to the coil during a drag. Both help keep the coil cooler and within the temperature range set by the user. A dry coil or one which isn’t getting air will heat rapidly, thereby triggering the mod to stop supplying power to the coils which in turn results in a vape that is anemic but without a dry hit. So when either of these things, juice or air, gets cut off and the temperature rises, the vape is basically over…if TC is functioning properly.
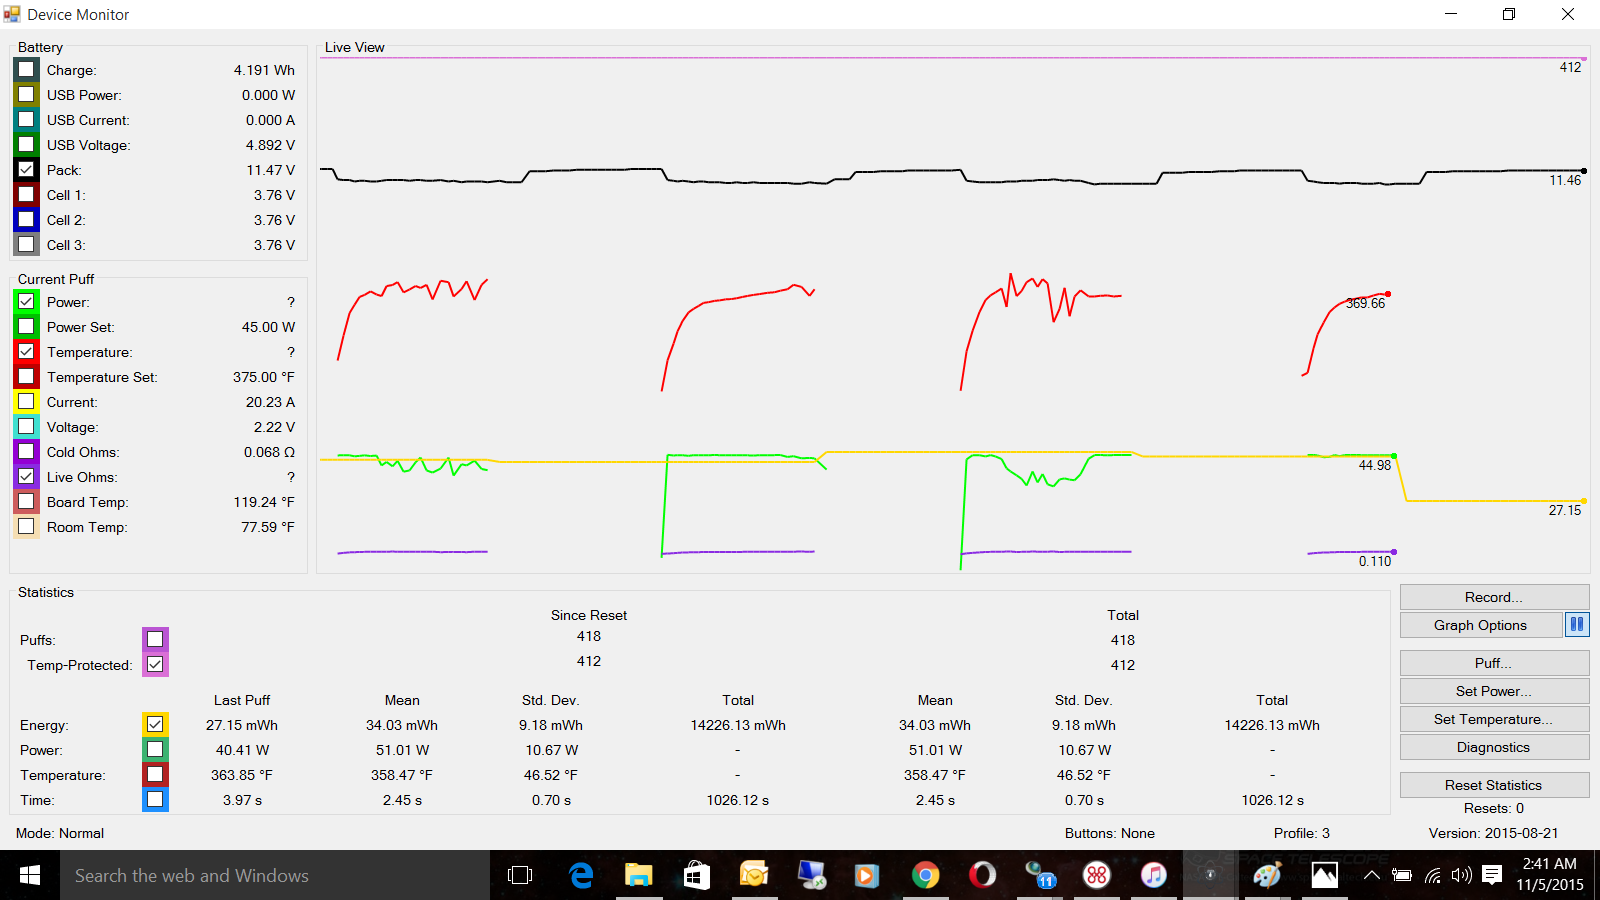
I was able to force the mod into an erratic temperature controlling state by taking quick short puffs during a drag. The attached screenshot show the red line indicating temperature. The smooth curve lines are where i was taking a normal drag, but the jagged lines are when I was doing to short puffs. This tells me if I was experiencing poor performance I could connect and run this monitor, and if I saw this I would know I either had an airflow issue or a wicking issue.Of course I could also monitor resistance and if that was jumping around dramatically it would likely indicate a bad connection, perhaps a coil leg that was loose or broken.
This is all very fascinating to me, but don’t let this new technology intimidate you. It’s really easy to work with and quite intuitive. Just like anything else new, you just have to learn it but I think it’s simpler now than what I had envisioned just yesterday.
Got Escribe knowledge you can share? Here’s a good place to put it. I will add more in the coming days. This is more fun than a trip to Disney World!