Obtaining more precise flavor percents

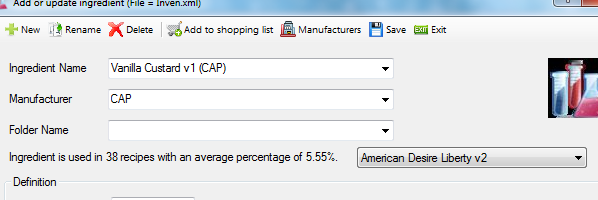
I noticed this information when I looked this flavor up on the other side:


Vanilla Custard v1 - Capella Flavors
You have this flavor

Bottle size: 13.00
ml Cost: 2.50
Weight in grams per ml: 1.0670
Flavor carrier: [ ] PG [ ] VG [x]Other
Preferred single flavor mix: ?.?? %

Flavoring MAY contain diacetyl - a flavoring used to create a butter flavor.
Contains Acetoin and Acetyl Propionyl
Materials Safety Data Sheet (MSDS) document

Manufacturer specified gravity: 1.067 g/ml

Percentages in recipes
Average mixing quantity: 4.3% (Median: 3%)
Minimum used quantity: 0%
Maximum used quantity: 75.8%

Single flavor recommendations: 141
Average quantity: 10.2% (Median: 10.0%)
Minimum used quantity: 0.5%
Maximum used quantity: 30.0%


Information I obtained from ANOTHER SOURCE.:

Vanilla Custard 12,50%
Averaged from: 8% 20% 11%18% 7% 11,00%


On this particular flavor the Average quantity: 10.2% (Median: 10.0%) is not too far off Dampfaromen-Prozentebut’s 12.5% I’m wondering how many statistical outliers are used in ELR’s average?
Sometimes data might look like 6, 4.5


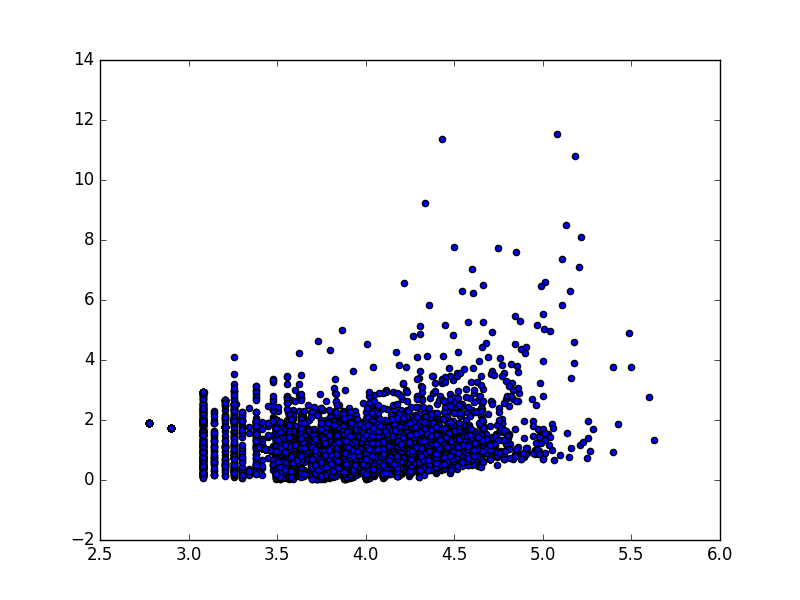
may actually be closer to 1.5, 4 once the outliers are removed.
This may be a good argument to have a check box for dripper/tanker, or possibly a way to view the data and manually deselect outliers hooligans and pranksters.

2 Likes

Yep. That’s something I asked for sometime back. (MTL vs DL checkbox)

It would probably be a royal PITA to code for since everything has already been done (in the way the site aggregates data), not to mention, I can’t see how it would have a way to be implemented so that all current data is accurately reflected (without wiping the current data slate clean).

Personally, I use VC v1 at 6% as a SA/SF.

1 Like

Interesting manually deselect outliers hooligans and pranksters. I like it

RDA checkbox adds Root Means Squared to calculation

I’d love to see an “outlier corrected” line underneath the average/median line that calculates the average/median sans all the data above or below X (maybe 2.5 or 3?) standard deviations. You’d have the typical average/median we see currently with the outlier corrected average/median right below it. That may remove a lot of the stones that cause the averages to be higher than normal non-stone recipes and abnormally high or low usages out of the data for the second line.

Or it could just split the data right there.

and the hooligans and pranksters.
it might be cool to see even a bar scale plot of the data

1 Like

My personal usage (from my recipes and those I gathered that use VC V1) is:

2 Likes